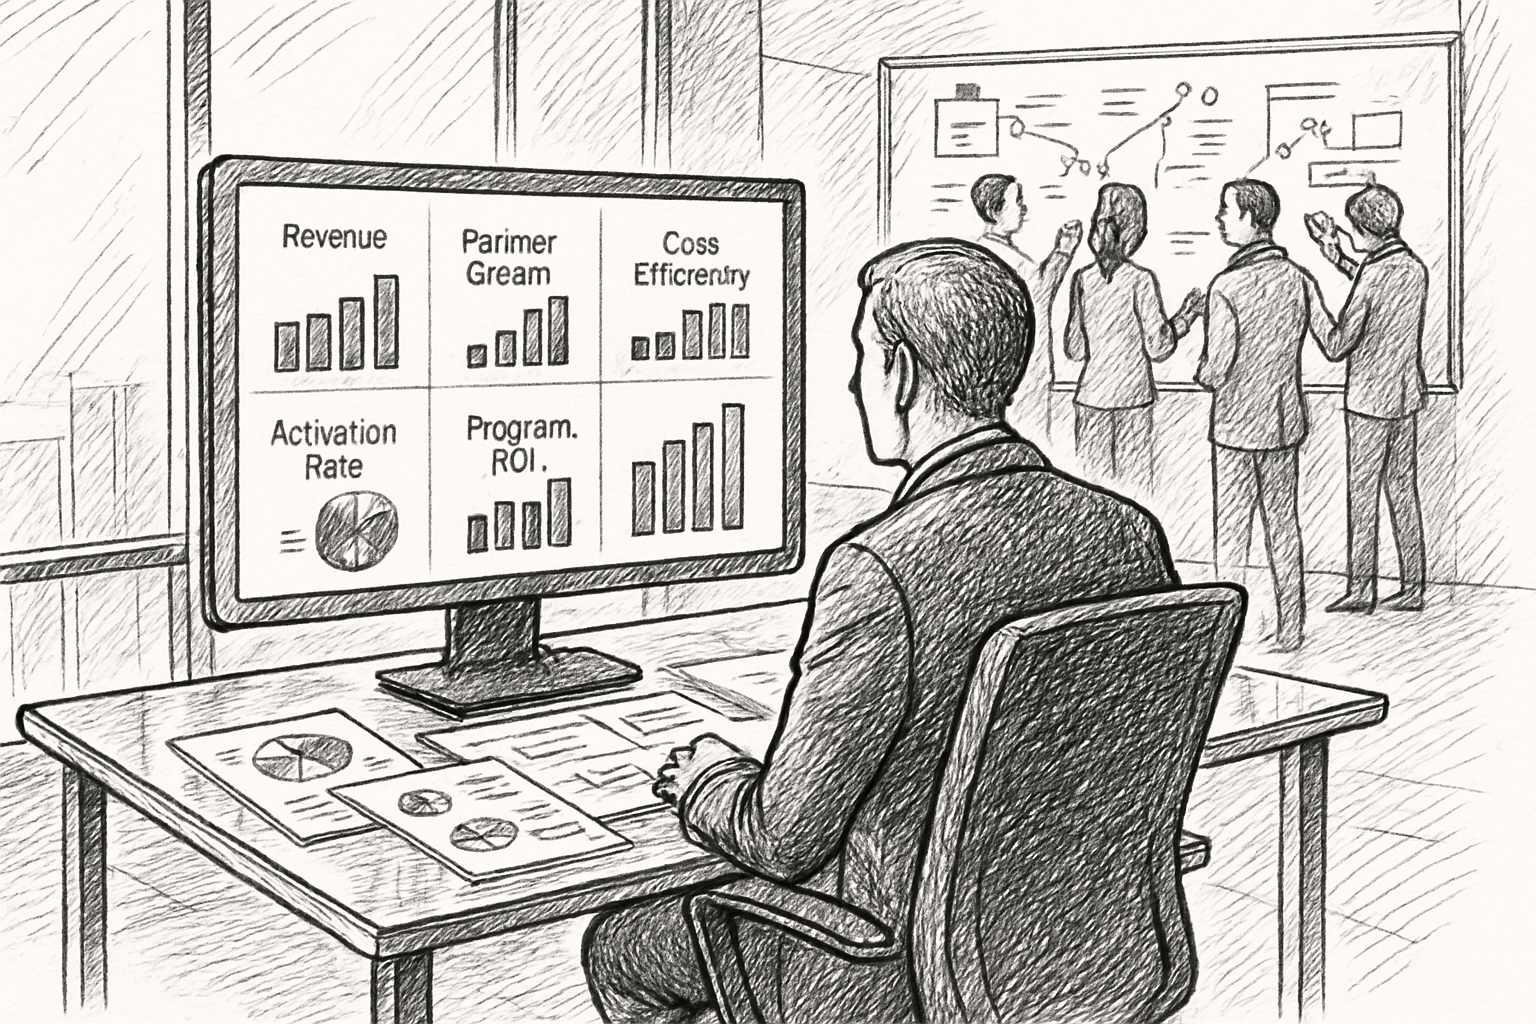
5 API Metrics Your CFO Actually Cares About
Your engineering dashboard is green. Uptime is 99.97%. Latency is under 50ms. Error rates are within tolerance.
Your CFO doesn't care about any of that.
When finance looks at your API program, they're asking one question: is this worth what we're spending on it? They don't need a technical readout. They need five numbers that tell them whether the program is a business asset or a line item waiting to be cut.
Here are the five metrics that actually survive a budget review, why each one matters, and how to present them without losing the room in the first slide.
1. API Program Revenue
The most direct metric: how much money does the API program bring in?
If you're charging partners for API access, this is total revenue from API subscriptions, usage fees, and overage charges. If you're pre-monetization, this is the estimated value of partner transactions that flow through your APIs.
Why your CFO cares: Revenue is the number that turns your team from a cost center into a business line. It doesn't need to be large to be meaningful. Even modest revenue changes the conversation from "how much does this cost?" to "how do we grow this?"
How to present it: Total revenue, month-over-month trend, and revenue per partner. The trend matters more than the absolute number. A program generating $15K/month with 20% month-over-month growth gets more budget than one generating $50K/month that's flat.
If you haven't started monetizing yet, present the usage data alongside the revenue opportunity: "40 partners made 2.3 million API calls last month. At our proposed pricing, that's $X in unrealized revenue." That's a business case, not just a dashboard. For help structuring the monetization conversation, see the complete guide to API monetization.
2. Cost per Partner Onboarded
How much does it cost your organization to take a partner from "interested" to "live in production"?
This includes engineering time spent on setup, support hours during integration, and any manual steps your team handles (credential provisioning, documentation handholding, legal review). Add up the hours, multiply by loaded cost, divide by the number of partners onboarded in the period.
Why your CFO cares: This is an efficiency metric. If it costs $5,000 in team time to onboard each partner, and the business wants to add 50 partners this year, that's $250,000 in onboarding cost alone. If you can show that number dropping, you're demonstrating operational leverage: growing the program without growing the team.
How to present it: Cost per partner, quarter over quarter. Show the trajectory. If self-service onboarding cut the cost from $5,000 to $800 per partner, that's a story finance understands immediately. Pair it with the headcount implication: "we onboarded 30 partners this quarter with the same team that onboarded 10 last year." For specifics on reducing onboarding time, start there.
3. Partner Activation Rate
What percentage of registered partners actually make it to production?
Registration is vanity. Activation is value. If 200 partners signed up but only 40 are live in production, your activation rate is 20%. The other 80% represent invested effort (yours and theirs) that produced nothing.
Why your CFO cares: A low activation rate means the program is leaking value at every stage. Partners are signing up, consuming onboarding resources, and then stalling before they generate any return. Finance sees this as waste: cost incurred without corresponding revenue or value.
How to present it: Show the funnel. Registered > active in sandbox > first API call > production. Put a number on each stage. The drop-off points tell the story. If 60% of partners stall between sandbox and production, that's a specific, fixable problem. If the activation rate is improving quarter over quarter, that's proof the program is getting healthier.
4. Program Cost vs. Program Value
What does the API program cost to run, and what value does it generate?
Program cost includes: engineering headcount allocated to the API program, infrastructure (gateway, hosting, monitoring), support costs, and any tooling. Program value includes: direct API revenue (if monetized), partner-attributed revenue (if partners drive business through integrations), and cost avoidance (work that partners do via API that your team would otherwise do manually).
Why your CFO cares: This is the ROI calculation. It's the single metric that determines whether the program gets more budget, stays flat, or gets cut. Finance doesn't need it to be precise. They need it to be directional: is the program generating more value than it costs? Even a rough estimate changes the conversation.
How to present it: A simple ratio. "The API program costs $400K/year to run and generates $600K in direct revenue plus an estimated $1.2M in partner-attributed transactions." Don't overengineer the model. A defensible estimate beats a precise calculation that nobody trusts. For the full framework on making this case, see how to turn your API program from cost center to profit center.
5. Partner Growth Rate
Is the partner base growing, flat, or shrinking?
Not registrations. Active partners. Month-over-month change in the number of partners making API calls in production. This is the leading indicator of program health. Revenue, activation, and cost efficiency all follow from whether the partner base is growing.
Why your CFO cares: Growth rate is the metric that determines whether the program has a future, not just a present. A program with 30 active partners and 15% monthly growth looks very different from one with 100 active partners and 0% growth. Finance funds trajectories, not snapshots.
How to present it: A single trend line: active partners over time. Annotate it with the milestones that drove changes: "self-service portal launched here," "first paid plan launched here," "healthcare compliance content drove inbound here." Context turns a line on a chart into a narrative that finance can buy into.
Putting It Together: The One-Page API Program Review
Your CFO doesn't need a 30-slide deck. They need one page with five numbers:
| Metric | This Quarter | Last Quarter | Trend |
|---|---|---|---|
| API program revenue | $X | $Y | +/- Z% |
| Cost per partner onboarded | $X | $Y | +/- Z% |
| Partner activation rate | X% | Y% | +/- Z pts |
| Program cost vs. value | X:1 ratio | Y:1 ratio | +/- Z |
| Partner growth rate | X% MoM | Y% MoM | +/- Z pts |
Below the table, one paragraph: what you're doing to improve the numbers, and what you need (budget, headcount, tooling) to accelerate them.
That's the entire meeting. No technical jargon. No infrastructure metrics. Five numbers, a trend for each, and a plan.
For a broader look at what to measure and how to build the reporting infrastructure, see the complete guide to API program metrics.